Tackling blind spots in Europeanisation research: the impact of EU legislation on national policy portfolios
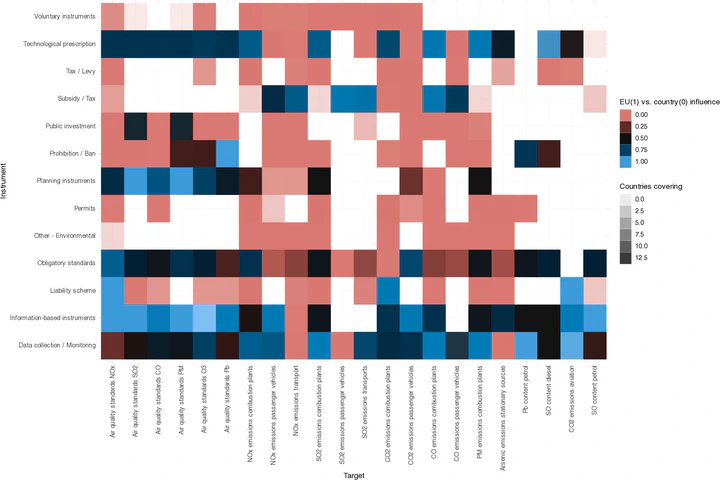
 Clean air policy portfolio across 13 member states, indicating all existing clean air policies in 2018 by origin.
Abstract
Research on the European Union over the years has significantly advanced our understanding of the domestic impact of EU policies. However, notable blind spots persist regarding the broader impact of EU legislation on national policy portfolios and its interaction with domestic policy-making. To address this gap, we introduce a novel analytical concept that adopts a macro-perspective to scrutinise the impact of EU policy-making on national policy portfolios and their trajectories over time. We analyse EU-induced change dynamics through three dimensions of national policy portfolios: policy efforts, policy innovation, and policy design quality. Applying our framework to clean air policy across 13 EU countries over 38 years, we find ambiguous effects on national policy-making. Our findings reveal that while the EU’s role in clean air policy has expanded, it simultaneously has constrained innovative potentials within national portfolios and challenged design quality, substituting rather than complementing national policy efforts. We contribute to the state of the art by providing a novel conceptual framework on the macro dynamics of multi-level policy-making, offering theoretical arguments on the expected effects of EU influence, and presenting empirical evidence of these dynamics.
Figures
Figure 1: Illustration of the EU clean air policy portfolio in 1980 and 2018. Figure 1
Figure 2: Development of the size of the EU clean air policy portfolio between 1980 and 2018. Figure 2
Figure 3: Temporal evolution of the size of clean air policy portfolios according to its origin. Figure 3
Figure 4: Average similarity between member states’ clean air portfolios and their components. Figure 4
Figure 5: Comparison of changes in average portfolio design quality, measured as Average Instrument Diversity (AID), resulting from national or EU-induced portfolio changes. Figure 5
Figure 6: Clean air policy portfolio across 13 member states, indicating all existing clean air policies (target-instrument combinations) in 2018 by origin. Note: Filled areas indicate existing policies. Different colours and gradients indicate the relative occupation of individual policies by EU or national policies. Figure 6